
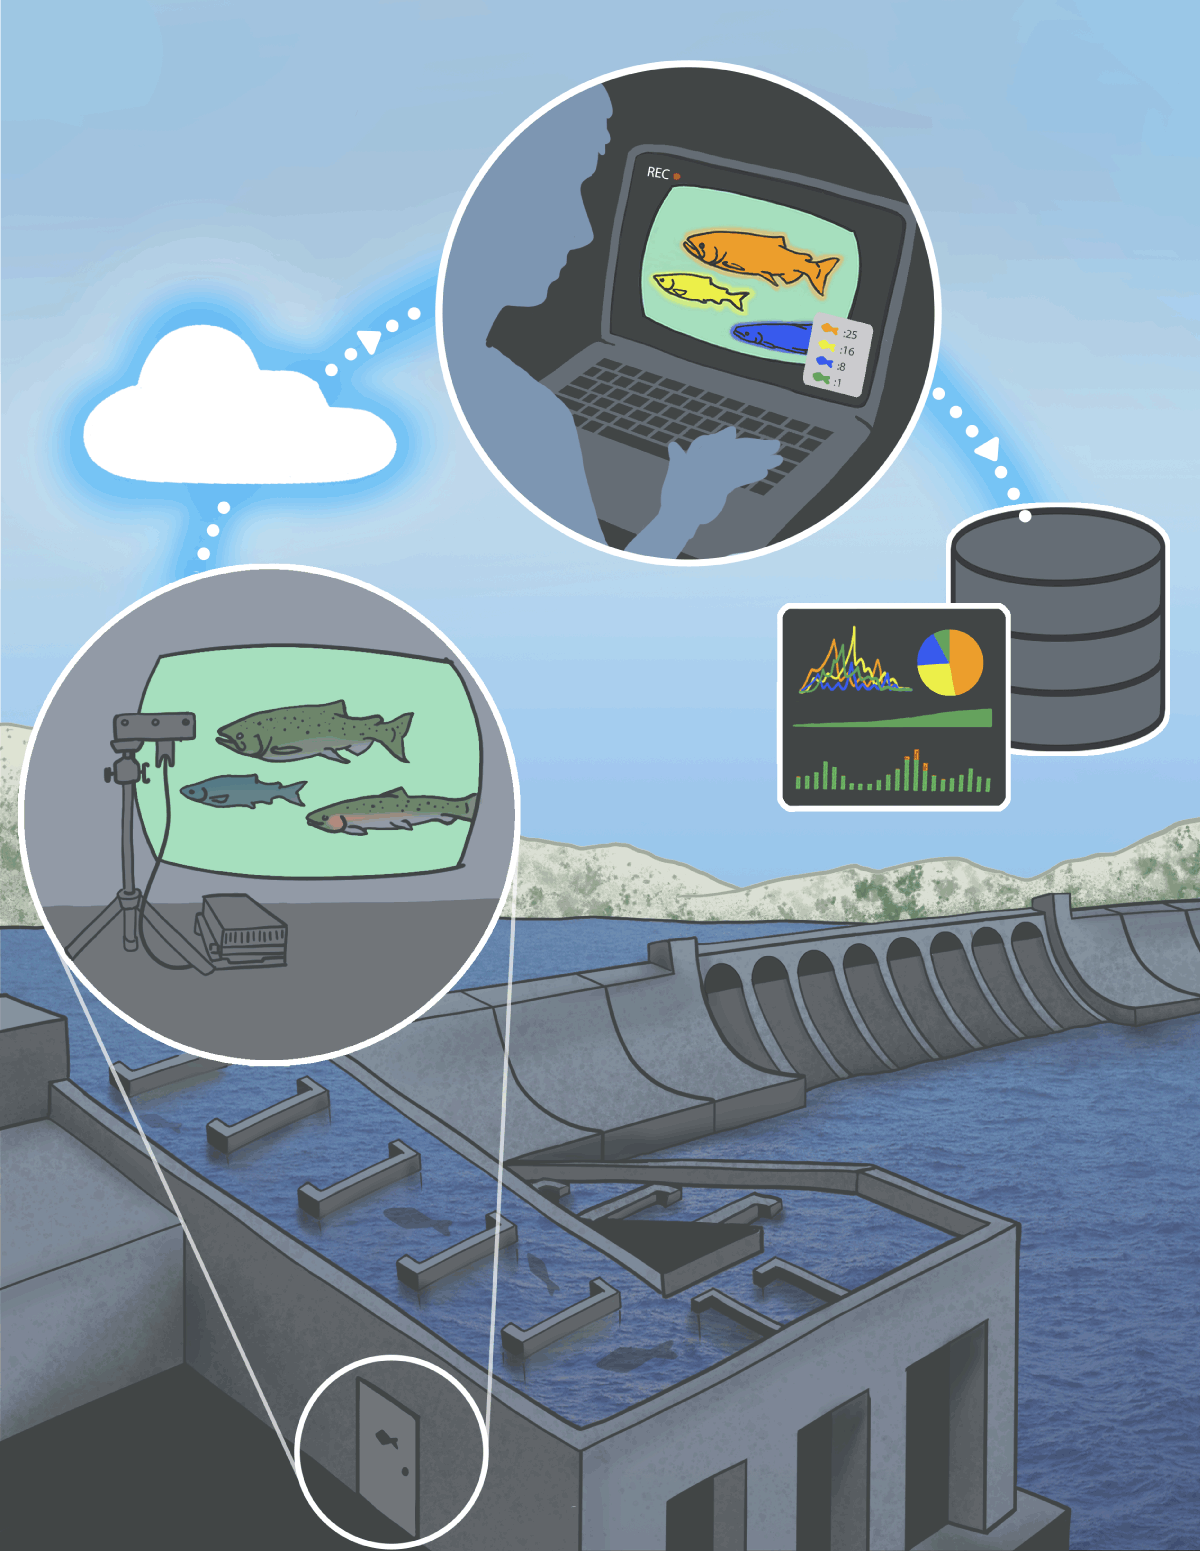
Fish Passage
Real-time, species-level counts
Accurate, Automated Fish Classification and Counts
Reporting passage data has never been easier.

At-A-Glance Insights
Simplify reporting with custom dashboards for the observations you care about.